This case study explores our transition of an internal health insurance claims processing tool from a static data table to an expandable card interface. Using the Double Diamond Model, we investigated the needs of our claims processing specialists, who require quick access to detailed policy and client data.


Challenge
The Problem
The operators struggled with the horizontal scrolling needed to see all the information in the data table.

Objective
Our Goal
Redesign the outdated data table into a user-friendly, scalable interface that allows quick access to key information.

Results
Our Findings
50% of users rated the new interface as "very intuitive"

Challenges
and Vision
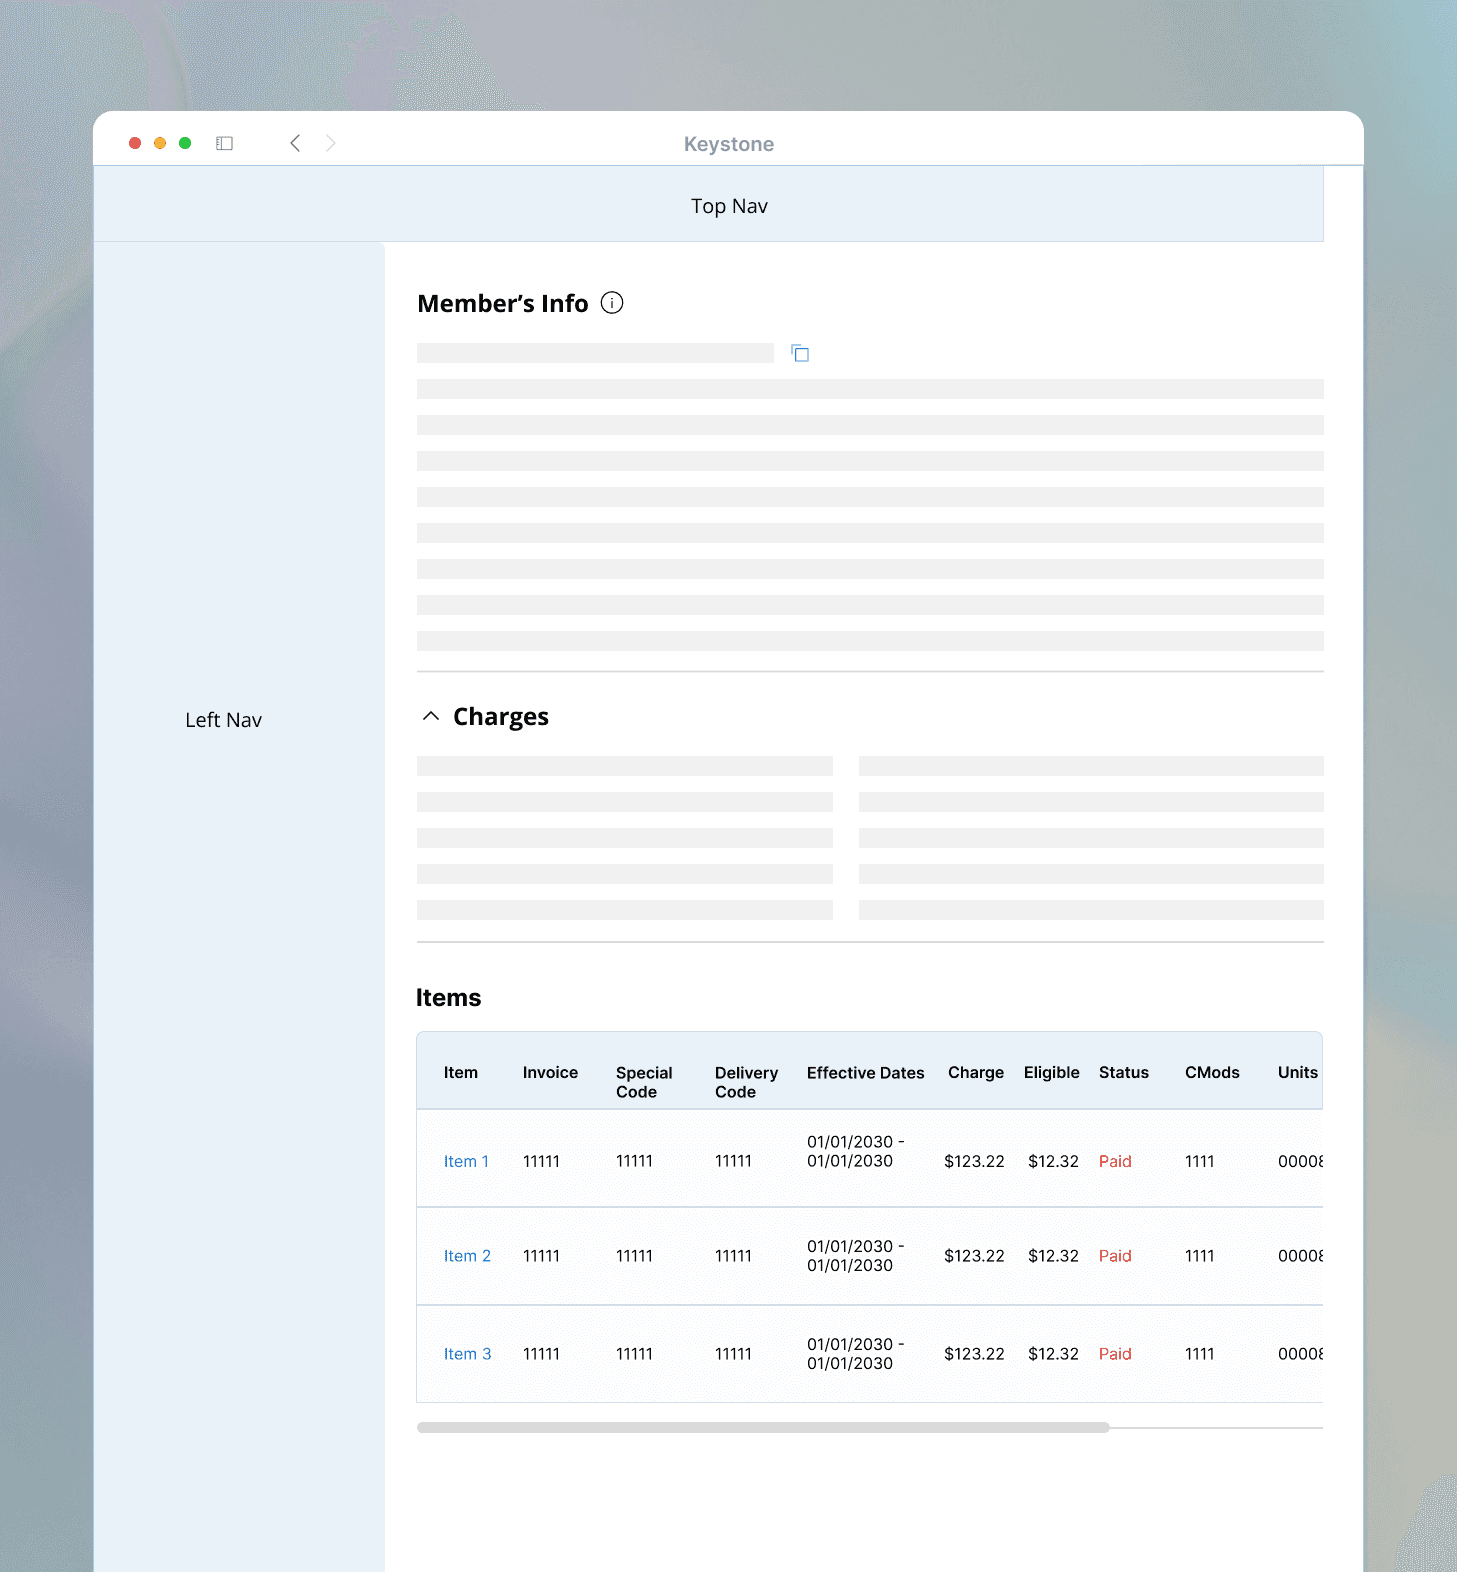
Leadership envisioned a refreshed, innovative interface. Claims processors (users) faced inefficiencies with the previous table UI:
Data overload from dozens of columns
Constant horizontal scrolling
disrupted workflow
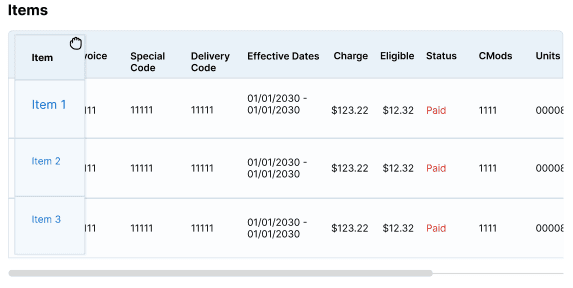
Iteration 1
Freeze Columns
Key Details Persistently Visible
Enabled freezing critical columns on left as users scrolled horizontally.

Iteration 2
Draggable Columns
Another approach involved adding drag-and-drop functionality to reorder and customize which columns were visible, reducing scrolling requirements.
Iteration 3
Data Cards
This modern, card-based approach displayed high-level information upfront within scannable card components. Each card could then expand on demand, utilizing progressive disclosure to grandfather in the familiar table layout with all available columns and rows.

Learning from Experience,
Looking Ahead
The redesign from static table to expandable card format successfully addressed user pain points and organizational goals. Despite initial apprehension, users quickly adapted and appreciated the improved workflow. By balancing information density with a clean interface, we significantly reduced task times. This project demonstrated the value of user-centered design in enhancing internal tools, even when guiding users toward streamlined, initially unfamiliar solutions. The new flexible foundation positioned us well for future adaptations and maintaining an efficient claims processing workflow.